
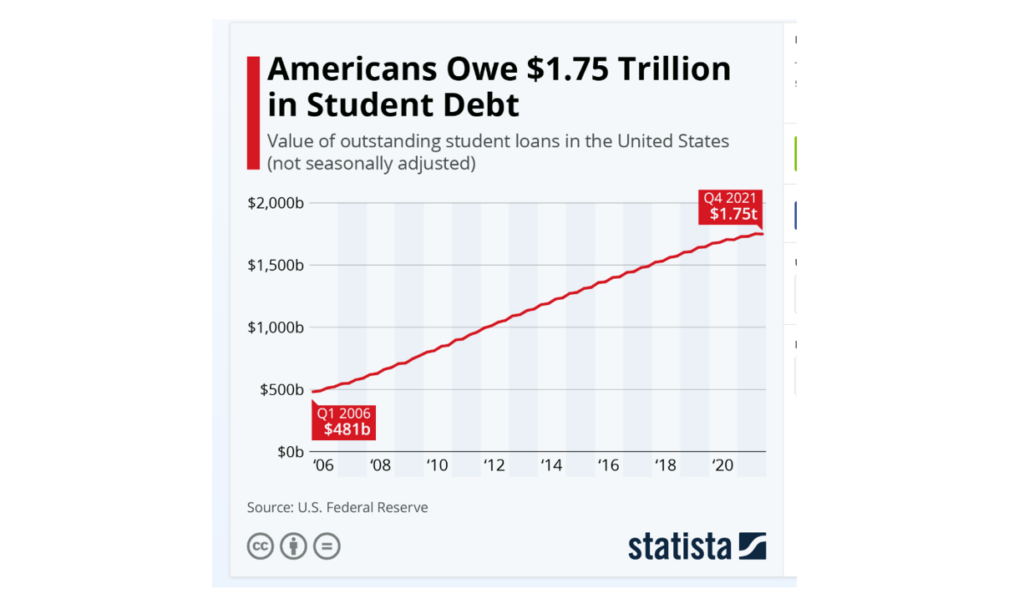
There is no doubt that from the past few years the cost of education has increased rapidly and the amount of loan student is taking for completion of their student or specific course has also been on the peak from the past few decades.
In fact as per the stats more than 43 million American carry student loan debt with the total surpassing of one point seven dollar trillion and not only that the average borrowers goes around $37,000 for completing their degree from college.
The worst part is this debt does not only effect your finances but also impact your mental health career choices and even personal relationships.
In this article I have compiled the list of more than 100 student loan debt statistic to give you the accurate idea of how much loan students are taking just to complete their education, we have categories the student debt loan on various forms like
- Key Student Loan Debt Statistics
- Student Loan Debt By Race
- Average Student Debt by State
- Average Student Loan by Degree Type
- Student Loan Debt Statistics By Gender
So let’s dive deeper into this and understand about the Student Loan Debt Statistics.
Key Student Loan Debt Statistics
- The collective student debt currently stands at $1.75 trillion in the United States. ( U.S. Federal Reserve)
- About 1 in 5 Americans hold student loans. ( Washington post)
- More than half of those 45 million people with federal student loans have $20,000 or less to pay, with about a third of all borrowers owing less than $10,000. Seven percent of people with federal debt owe more than $100,000 ( Washington post)
- Thirty percent of all adults—representing more than 4 in 10 people who went to college—said they took out student loans for their education. (U.S. Federal Reserve)
- This includes 21 percent of college attendees who still owed money on outstanding loans (“student loan borrowers”) and 21 percent who borrowed but fully repaid their education debts. (U.S. Federal Reserve)
- Adults ages 30 to 44 were most likely to have taken out student loans for their education. In contrast, older adults were less likely to do so, consistent with the upward trend in educational borrowing over the past several decades. (Federal Reserve)
- Adults under 30 were also less likely to have taken out student loans than adults ages 30 to 44, potentially because many young adults have nwashingtonpostot yet completed their education.(Federal Reserve)
- Most student loan borrowers with outstanding debt owe less than $25,000 on their educational loans. (Federal Reserve)
- The median amount of education debt in 2022 among those with any outstanding debt for their education was between $20,000 and $24,999. ( Federal Reserve)
- Over one-fourth of student loan borrowers had less than $10,000 in outstanding student debt from their education. (Federal Reserve)
- The average public university student borrows $32,362 to attain a bachelor’s degree.(Research.com)
- 6 percent of adults had student loans that paid for a child’s or grandchild’s education. The median amount of debt for a child or grandchild’s education was between $15,000 and $19,999. (Federal Reserve)
- 28% of borrowers with loans outstanding who completed less than an associate degree reported being behind, as did 25 percent of borrowers earning less than $25,000. (Fedral Reserve)
- The average federal student loan debt balance is $37,853, while the total average balance (including private loan debt) may be as high as $40,681 (Education Data Initiative)
- Just above one-fourth of student loan borrowers had less than $10,000 in outstanding student debt from their own education. (Federal Reserve)
Federal Student Loan Debt By Age
- Federal student loans account for 92% of student debt, and the remaining percentage is private student loans. (Peter G Peterson Foundation)
- $500 billion in federal student debt is owed by borrowers between the ages of 25 to 34. Between $10,000 and $40,000 is owed by the majority of people in this age group. (Chamber of Commerce)
- Student debt is carried well into the middle-aged group and beyond. Therefore, $620 billion in student loans are owed by Americans between the ages of 35 to 49. (Statista)
- On a percentage basis, the largest increase in student loan debt has come from a surprising age group: 60 to 69-year-olds, who have experienced a 71.5% increase in student loan debt.(Forbes)
- On a dollar basis, the highest increase in student loan debt is among 30 to 39-year-olds, who as a group now hold over $461 billion in student loans. (Forbes)
- On a percentage basis, the amount of student loan debt held by 30-39-year-olds has increased by 30.2% over the past five years. (Westcliff Univerisity)
- The largest concentration of student loan borrowers is under 30 years old, followed by the 30-39 age group. (WestCliff University)
- There are 29.1 million student loan borrowers under the age of 39, with this group representing approximately 65% of all student loan borrowers. (Westcliff Univerisity)
- Total student loan debt by age, at $634.8 billion in Q2 2024, 35-to-49-year-old borrowers owed the most substantial amount. (Investopedia)
- The second-highest amount belonged to the 25-to-34 demographic, which owed $489.6 billion in total as of this same period. (Federal Student Aid. “Federal Student Loan Portfolio)
- Those between 50 and 61 owed $284.5 billion. At $99 billion, the smallest amount of total student loan debt belongs to the 24-and-younger group. ( Federal Student Loan Portfolio)
- According to Federal Student Aid, 24-and-younger borrowers are the only age group to owe less student loan debt in 2024 than in 2017. (National Student Clearinghouse Research Center)
- The largest increase was for the 35-to-49-year-olds who experienced a $150 billion increase. This number is much higher than the $12.2 billion increase in total borrowing experienced by the 25-to-34-year-olds. (Federal Student Loan Portfolio,”)
According to Investopedia Research, here is the finding on student loan debt by age.
- 24 and Younger: Generation Z (12–24)
- 28 to 34: Majority of the millennial generation
- 35 to 49: Millennials (35–43); Generation X (44–49)
- 50 to 61: Generation X (50–59); baby boomers (60–61)
- 62 and Older: Baby boomers (62–78); silent generation (79–96)
- The above data is the sources from different years and is presented to give you an idea about the age of the student who took a loan to complete their study.
- The 62 and older age group has experienced the most significant increase in their average student loan debt since 2017. (Federal Student Loan Portfolio)
- The 24-and-younger range was the only one to experience a decrease in the average student loan debt per borrower during that same period. (Federal Student Loan Portfolio)
Student Loan Debt By Race
- The average amount borrowed by Asian students is $49,100. (NCES)
- 2015–16 bachelor’s degree recipients, 86.3 percent of Black graduates still owed federal student loan debt 12 months after completion—compared to 70.1 percent of Hispanic graduates.
- 67.7 percent of White graduates, and 43.9 percent of Asian graduates (National Center for Education Statistics, 2021).
- But the median debt-to-asset ratio for white families is 26.5%, while it was 46.8% for Black families, 46.2% for Hispanic families, and 37.3% for other non-white races and ethnicities, an Employment Benefits Institute study found. (Debt.org)
- When it comes to mortgages, the median amount was $130,000 for white borrowers, $116,000 for Black borrowers and $130,000 for Hispanic borrowers. (Debt.org)
- An analysis of data from the 2022 Survey of Household Economics and Decision making (SHED) shows that among Black women who have attended some college or higher in their lives, 43.3% had student loan debt in 2022. (Center for Economic and Policy Research)
- This is roughly two times the percentage of white women (19.9%) and three times the percentage of white men (15.7%). This percentage is up roughly 3 percentage points from 2018 and 1 percentage point from 2019. (Center for Economic and Policy Research)
- Across three of the racial and ethnic groups, women had higher shares of debt, 4.2 percentage points higher for white women than white men, 5.2 percentage points higher for Hispanic women than men, and 11.2 percentage points higher for Black women than men. (Center for Economic and Policy Research)
- The only group in which the percentage of men with student debt was higher than that of women (18.1% and 16%) was those who identify as multi-racial or as another race/ethnicity besides Hispanic, Black, or white. (Center for Economic and Policy Research)
- The median Black student loan debt is $26,000. It’s $25,000 for white borrowers, $13,000 for Hispanic borrowers, and $25,000 for borrowers of other races. (Best College)
- Black borrowers are also more likely to have higher debt balances. Over half of Black student loan borrowers have at least $25,000 in student loan debt from their education, versus 41% of white borrowers and 37% of Hispanic borrowers. (Best College)
Source : aauw.org
- Brookings’ analysis found the debt gap between Black and white student borrowers more than triples by four years after graduation.
- After four years, Black college graduates owe 6% more than their initial loan amount while white college grads owe 10% less than what they borrowed. (Brookings)
- Black women borrow the highest amount of student loan debt on average — over $20,000 more than white men, who borrow the least amount of student loan debt, on average. (Best College)
- Black and Hispanic Americans have the lowest rates of educational attainment, with only 21 percent of Hispanics and 28 percent of Black Americans having a bachelor’s degree or higher, compared with 42 percent of non-Hispanic Whites and 61 percent of Asian Americans. (McKinsey & Company)
- Hispanic students are more averse to borrowing than other groups. In 2019, only 15.3 percent of Hispanics had student loan debt, compared to 19.8 percent of white and 35.9 percent of Black individuals. (Federal Reserve)
- The median student loan balance of Hispanic borrowers is $13,000, half of what Black students borrow. (Federal Reserve).
- Twelve years after starting college, the median Latino borrower owes about 83 percent of their original student loan balance. By contrast, white borrowers only owe 65 percent of their initial student loan balance during that same timeframe. (Protect Borrowers)
- The average amount borrowed by American Indian and Alaska Native students is $36,900.(NCES)
- American Indian and Alaska Native borrowers owed 87 percent of their original student loan balance four years after graduation, while white borrowers owed 73 percent. (NCES)
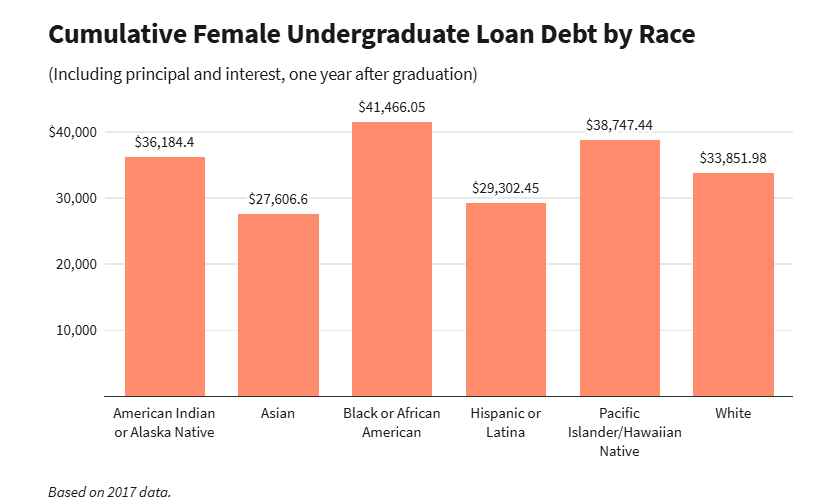
- Out of all female undergraduate borrowers, Asian women carry the lowest student loan balance, borrowing an average of $25,252 and owing $27,606.60 one year after graduation. (aauw.org)
- Four years after obtaining their bachelor’s degree, white borrowers owed 73 percent of their initial student loan balance in 2020. (NCES).
- Just under twenty percent of white households reported having student loan debt in 2022. By contrast, nearly 40 percent of Black households and 15.3 percent of Hispanic households reported having student loan debt. (Federal Reserve)
- Nine percent of white borrowers were behind on their student loan payments in 2021, compared to 17 percent of Black borrowers and 18 percent of Hispanic borrowers. (Federal Reserve)
Average Student Debt by State
- The average federal student loan debt across the 50 U.S. states, Puerto Rico, and the District of Columbia amounts to $29.9 billion per state in 2024, (Education Data Initiative)
- Washington, D.C. leads the U.S. in average federal student loan debt at $54,795 per borrower and has the highest share of borrowers, with 17.2% of residents in debt.
- Many borrowers in D.C. are recent graduates, including a significant number with master’s degrees, compounding the strain of the city’s steep cost of living. (Washington Post)
- Second-ranked Maryland, which borders D.C., is also one of the most educated states in the country. Around 43% of Maryland residents have earned at least a bachelor’s degree, significantly higher than the national average of 35%. (CBSNews)
- North Dakota has the nation’s lowest average student loan debt, and it’s the only state with average debt under $30,000, at $29,647. Only about 11.2% of state residents have student loan debt. (Visual Capitalist)
- Average student debt at graduation in 2020 ranged from $18,350 in Utah to $39,950 in New Hampshire and new graduates’ likelihood of having debt varied from 39 percent in Utah to 73 percent in South Dakota. (Education Resources Adminitration Center)
- For those graduating college in the United States in 2020, five-figure debt was the norm across all states. Students in New Hampshire had the highest debt levels in the country, at 39,928 U.S. dollars on average. (Statista)
- The lowest average amount of debt that students had was in the state of Utah at 18,344 U.S. dollars. (Education Data Initiative)
- The US Northeast region has the highest average student loan debt per borrower out of the four regions at $35,455. (Study.com)
- The Northeast region also has the state with the highest student loan debt per borrower in the nation, New Hampshire. New York has the lowest average in the region at $30,951. (Study)
- Delaware has the highest average ($39,705) student loan debt by state in the US South region, while Florida has the lowest ($24,454). (Study.com)
- The average student loan debt per borrower for the region is $29,420, the second-lowest debt per borrower average in the United States. (Study.com)
- In the US Midwest region, South Dakota has the highest average of federal loan borrowers at $32,029. (Study.com)
- Kansas is the lowest in the region at $26,002, which is below the average student loan debt per borrower in the US Midwest region ($29,570). (Education Data Initiative)
- The region with the lowest average student loan debt per borrower is the US West region. Its average federal loan debt per borrower is just $23,600. (Study.com)
- The West region has the state with the lowest average in the country Utah, with average debt per borrower of $18,344. Montana has the highest average student loan debt by state in the region at $27,114.
Average Student Loan by State Complete List
As of now, you have seen the average student loan by state from highest to the lowest and now let’s have the complete overview of the states as per the average student debt.
| State | Total Borrowers | Average Debt | Percent Delinquent |
| Alabama | 632,800 | $37,137 | 9.5% |
| Alaska | 67,600 | $34,024 | 6.9% |
| Arizona | 887,100 | $35,396 | 8.7% |
| Arkansas | 390,000 | $33,333 | 9.0% |
| California | 3,823,700 | $37,084 | 7.1% |
| Colorado | 774,000 | $36,822 | 7.0% |
| Connecticut | 497,700 | $35,162 | 6.3% |
| Deleware | 127,800 | $37,559 | 6.8% |
| District of Columbia | 118,300 | $55,945 | 7.8% |
| Florida | 2,623,600 | $38,459 | 8.2% |
| Georgia | 1,647,500 | $41,639 | 9.4% |
| Hawaii | 122,400 | $36,765 | 7.7% |
| Idaho | 218,100 | $33,012 | 6.5% |
| Illinois | 1,631,500 | $37,757 | 6.7% |
| Indiana | 906,500 | $32,874 | 9.4% |
| Iowa | 433,300 | $30,848 | 7.6% |
| Kansas | 383,700 | $32,578 | 7.7% |
| Kentucky | 601,000 | $32,779 | 10.0% |
| Louisiana | 651,700 | $34,525 | 9.3% |
| Maine | 187,100 | $33,137 | 5.9% |
| Maryland | 837,600 | $42,861 | 6.8% |
| Massachusetts | 902,000 | $34,146 | 4.9% |
| Michigan | 1,412,100 | $36,116 | 7.9% |
| Minnesota | 788,600 | $33,604 | 5.8% |
| Mississippi | 439,000 | $36,902 | 10.7% |
| Missouri | 833,400 | $35,397 | 8.1% |
| Montana | 126,700 | $33,149 | 5.6% |
| Nebraska | 247,500 | $31,919 | 4.8% |
| Nevada | 349,700 | $33,743 | 9.8% |
| New Hampshire | 190,700 | $34,085 | 4.8% |
| New Jersey | 1,199,400 | $35,434 | 5.8% |
| New Mexico | 228,000 | $34,211 | 8.7% |
| New York | 2,460,300 | $37,678 | 4.9% |
| North Carolina | 1,304,300 | $37,721 | 8.0% |
| North Dakota | 87,400 | $28,604 | 5.0% |
| Ohio | 1,794,300 | $34,721 | 8.2% |
| Oklahoma | 488,500 | $31,525 | 9.6% |
| Oregon | 543,000 | $37,017 | 8.3% |
| Pennsylvania | 1,822,800 | $35,385 | 7.2% |
| Rhode Island | 143,500 | $32,056 | 6.1% |
| South Carolina | 731,500 | $38,414 | 9.1% |
| South Dakota | 116,300 | $30,954 | 5.3% |
| Tennessee | 862,200 | $36,418 | 9.0% |
| Texas | 3,645,200 | $32,920 | 8.5% |
| Utah | 307,600 | $32,865 | 5.8% |
| Vermont | 77,300 | $37,516 | 5.0% |
| Virginia | 1,082,600 | $39,165 | 6.4% |
| Washington | 788,500 | $35,510 | 6.3% |
| West Virginia | 227,200 | $31,690 | 11.0% |
| Wisconsin | 727,400 | $31,894 | 6.0% |
| Wyoming | 54,400 | $31,250 | 6.6% |
Average Student Loan by Degree Type
- 60% of graduate students take out federal student loans. (Bank Rate)
- On average, master’s degree holders have over $83,600 in student loan debt. (Bank Rate)
- PhD holders graduate with roughly $134,800 in student loan debt. (Bank Rate)
- In 2019-2020, the average student loan amount borrowed for a four-year bachelor’s degree was $30,500 (Best College)
- The Federal Reserve reports that the median student debt for all borrowers in 2023 was between $20,000 and $24,999. (Best College)
- The average federal student loan debt has more than doubled since 2007, from $18,233 in 2007 to $37,850 in 2024. (Best College)
- Among borrowers who attended some college but didn’t have a bachelor’s degree, the median owed was between $10,000 and $14,999 in 2023. (Pew Research)
- Among borrowers with a postgraduate degree, the median owed was between $40,000 and $49,999. (Pew Research)
- About half of borrowers with a bachelor’s degree (49%) and an even higher share of those with a postgraduate education (71%) owed at least that much. (Pew Research)
- Adults with a postgraduate degree are especially likely to have a large amount of student loan debt. (Pew Research)
- About a quarter of these advanced degree holders who borrowed (26%) owed $100,000 or more in 2023, compared with 9% of all borrowers. Overall, only 1% of all U.S. adults owed at least $100,000. (Pew Research)
- A quarter of college graduates ages 25 to 39 with loans say they are either finding it difficult to get by financially or are just getting by, compared with 9% of those without loans. (Pew Research)
- Only 29% of young college graduates with outstanding student loans say they are living comfortably, 53% of those without loans say the same. (Pew Research).
| Debt type | Average debt |
|---|---|
| Bachelor’s degree debt | $29,300. |
| Graduate school loan debt | $77,300. |
| Parent PLUS loan debt | $30,639. |
| Law school debt | $132,740. |
| MBA student debt | $51,850. |
| Medical school debt | $212,341. |
| Dental school debt | $296,500. |
| Pharmacy school loan debt | $170,956. |
| Nursing school student debt | $40,000-$54,999. |
| Veterinary school debt | $202,647. |
Source: Nerd Wallet
- College graduates ages 25 to 39 who have student loan debt have higher household incomes than non-college graduates in the same age group, But their household incomes are lower than those of young college graduates who don’t have student loan debt. (Pew Research)
- Around half of young college graduates with student loans (48%) have household incomes of at least $100,000. That compares with just 14% of non-college graduates. But among college graduates without student loan debt, 64% have household incomes of $100,000. (Pew Research)
- About a third (35%) of those ages 25 to 39 who have at least a bachelor’s degree and outstanding student loan debt say the benefits of their degree weren’t worth the lifetime financial costs. (Pew Research)
Student Loan Debt Statistics By Gender
- The American Association of University Women (AAUW) estimates that women hold nearly 67% of all U.S. student loan debt, or approximately $929 billion.
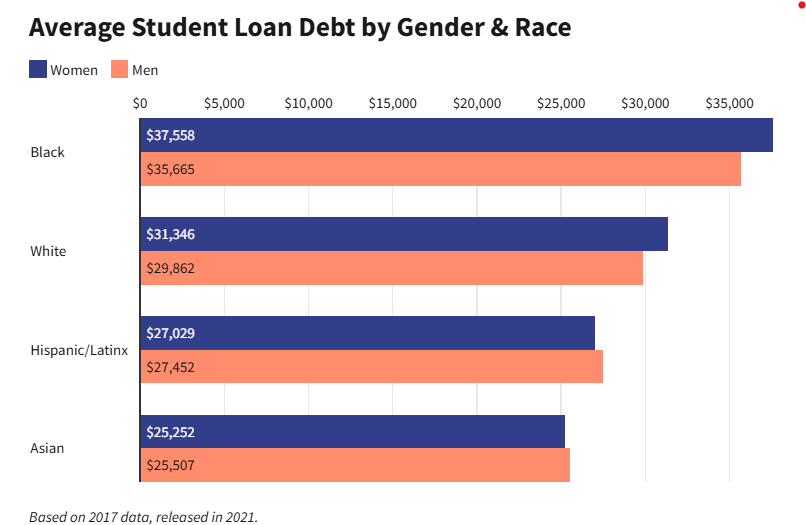
- Black women owe the largest amount of debt, followed by White, Hispanic/Latinx, and Asian borrowers.
Source: aauw.org
- Women graduate owing $3,120 more on average than their male counterparts—an average of $22,000 in student debt, compared to $18,880 for men.(AAUW).
- Women graduating with a bachelor’s degree are expected to earn $35,338 on average, which equates to approximately 81% of what men anticipated earning (American Association of University Women)
- Female students borrowed $51,035 on average for graduate school, which can increase to an average of $61,626 a year after graduation, thanks to interest. (American Association of University Women)
- Women hold an average of $31,276 in student debt, leaving them with a monthly loan payment of $307 the year after graduation. (American Association of University Women)
- Female students borrowed $51,035 on average for graduate school, which can increase to an average of $61,626 a year after graduation, thanks to interest. (American Association of University Women)
- At $37,558, Black women had the highest average student loan debt, followed by White women at $31,346. (American Association of University Women.)
- Hispanic/Latinx women owed slightly less ($423) than men in this same group. Similarly, Asian women not only had the lowest debt amount of all female borrowers but also owed slightly less than Asian men. (Investopedia)
- At $41,466.05 on average, Black women owed the largest amount of debt, followed by White, Hispanic/Latinx, and Asian borrowers. (Investopedia)
- Female students are 49.9% more likely than male students to take out federal student loans when pursuing an associate’s degree. (Chamber Of Commerce).
Conclusion : Average Student Loan Debt (2025)
From the ever post you have seen the facts figure and stats about the average student loan debt and you also got the complete idea of how much loan a student take on an average to complete their education and get a good job.
I hope from the above state you got the idea that if you want to complete your studies it’s better to save from the initial stage so you don’t have to take a student loan for completion of your studies.
Lastly if I have left something in the ever post please let me know in the comments section we’ll happy to know your feedback about this post.
Sources Used in this Article Inludes are :-
- Student Loan Debt in the U.S. – Key Statistics
- Federal Reserve Report on Student Loans and Economic Well-Being
- Forbes: Student Loans Impact on Parents and Seniors
- Student Loan Debt by Age – Investopedia
- Comparing Student Loan Debt to Other Debts
- 2018 Student Loan Debt Crisis Report
- Student Loan Debt by Age – Detailed Breakdown
- Average Debt for a Bachelor’s Degree
- States with the Lowest and Highest Student Debt
- Student Loan Debt by Race and Ethnicity
- Bankrate: Student Loan Debt by Race
- Brookings: Black-White Disparity in Student Loan Debt
- Debt.org: Demographics of Americans in Debt
- Comprehensive Student Loan Debt Statistics
- Disparities in Wealth by Race – Federal Reserve
- AAUW: Women and Student Debt Issues
- AAUW: Policy Positions on Student Debt
- Deeper in Debt – AAUW Research
- Student Debt Quick Facts – AAUW (2022)