
Did you know that college enrollment rates have dropped by nearly 1 million students in the past few years? Or that online education is seeing an all-time high in enrollment?
If you’re trying to figure out the current state of college admissions, these numbers might leave you with more questions than answers.
In this article, we’ll break down the key insights and latest facts about college enrollment in 2025—who are applying, which types of institutions are seeing growth or decline, and what factors are shaping the future of education. Let’s dive in!
Key College Enrollment Statistics
- 124,000 more students, equivalent to a 4.6% increase, enrolled at the graduate level. (Research)
- The largest decrease in college enrollment per major is in English, which is at 10.2%. (Research)
- Approximately 18.66 million individuals in the United States will be college students in 2023. (NCED)
- Around 16 million students are enrolled in degree-grating postsecondary institutions and colleges in the United States. (NCED).
- Graduate enrollment also showed an impressive 3.0% increase, surpassing undergraduate growth. (Mission Graduation)
- In fall 2021, female students and male students made up 58 percent of total undergraduate enrollment (8.9 million students). (NCED)
- There is a 9.5% decrease in the enrollment rate in community colleges. This is equivalent to 476,000 fewer students. (Research)
- An 8.2% increase in enrollment rates is reported in education doctoral degree programs. (Research)
- 65% of the students who enrolled in Fall 2023 attended full-time college, while 35% attended part-time. (Mission Graduation)
- The average college enrollment rates for underserved students were 56.6% for Blacks and 56.2% for Latinx, compared with 62.7% nationally (US Bureau of Labor Statistics 2021).
- In 2022, about 6.57 million male students were enrolled in degree-granting postsecondary institutions as undergraduates, compared to 8.82 million female undergraduate students who were enrolled in that same year. (Statistica)
- By 2031, these figures are projected to increase to 7.12 million and 9.7 million respectively. (Statistica).
College Enrollment Stats by Degree
- About 14.3% of adults had an advanced degree in 2021, up from 10.9% in 2011. (census.gov)
- In fall 2023, more than 18 million students were enrolled in degree-granting colleges and universities, about three-quarters of them in public institutions. (NBER)
- In 2022, about 61.4% of U.S. high school graduates enrolled in college, and 36% of the U.S. population aged 25 and above had a Bachelor’s degree or higher.(Bureau Of Labor)
- Around 47.6% of students were enrolled in bachelor’s degree programs and 24% in associate degree programs. (NSCRC)
- Associate degrees saw a 6.3% enrollment increase in 2024, with community colleges experiencing the strongest growth at 4.7%. (Community College Daily)
- The percentage of the population aged 25 and older with associate degrees rose from 9.5% to 10.5% between 2011 and 2021. (Census.gov).
- Between 2011 and 2021, the percentage of people age 25 and older who had completed a bachelor’s degree or higher increased by 7.5 percentage points from 30.4% to 37.9%. (Census.gov)
- From 2011 to 2021, the number of people aged 25 and over whose highest degree was a master’s degree rose to 24.1 million.
- The number of doctoral degree holders rose to 4.7 million, a 50.2% and 54.5% increase, respectively. (Census.gov)
- In 2021, of adults age 25 and older who had completed a bachelor’s degree or more, 53.1% were women and 46.9% were men. (Census.gov)
- Certificate programs saw explosive 9.5% annual growth, with graduate certificates specifically increasing nearly 10% and these now account for 28.9% of all enrollment growth since 2019 (Education Dynamics).
Here is the tabular representation of the college enrollment statistics
| Degree Level | 2021 Percentage | 2024 Enrollment Trends |
| Associate Degrees | 26.30% | 6.3% annual growth |
| Bachelor’s Degrees | 48.60% | 2.9% annual growth |
| Master’s Degrees | 20.30% | 7.4% increase |
| Doctoral Degrees | 4.60% | 3.6% increase |
- In fall 2021, nearly all undergraduate students (95 percent) attending degree-granting institutions were enrolled across three sectors of institutions: public 4-year (48 percent), public 2-year (29 percent), or private nonprofit 4-year (17 percent) institutions. (NCED)
- In fall 2021, at least two-thirds of full-time graduate students at public and private nonprofit degree-granting institutions were under the age of 30. (NCED)
- Among part-time graduate students, 78 percent were age 30 and over at private for-profit institutions, as were 63 percent at private nonprofit institutions and 59 percent at public institutions. (NCED).
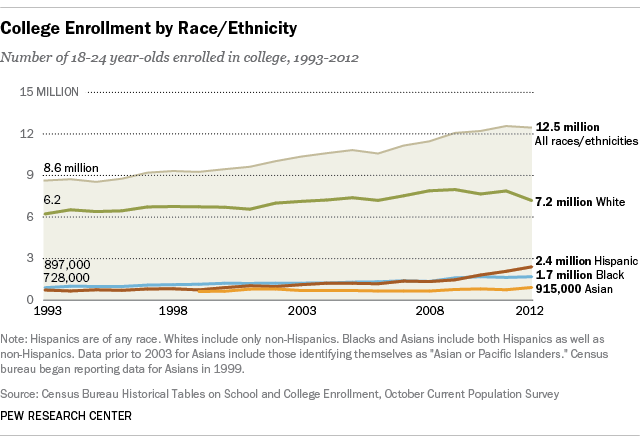
College Enrollment By Race or Ethnicity
- Black, Hispanic, and White Americans: ~60% are pursuing a college degree.(The Hechinger Report)
- Asian Americans: More than 80% enroll in college (highest enrollment rate).
- At public four-year schools, 45% of students were white, 39% were BIPOC, and 16% did not identify their race. (Best College)
- At public two-year schools, 37% of students were white, 45% were BIPOC, and 18% did not identify their race.(Best College)
- From 2002 to 2022, the share enrolled in college increased for American Indian or Alaska Native and Hispanic or Latino students but decreased for Asian, Black or African American, and White students. (Race and Ethnicity in Higher Education)
- Between 2003 and 2022, the share of college enrollment increased for Native Hawaiian and other Pacific Islander students, while it decreased for multiracial students.(Race and Ethnicity in Higher Education)
- Today’s students are more diverse in age, race, and income level than ever 34% are older than 25, and 43% identify as a race other than white. (Today’s Students Coalition)
- Private, nonprofit four-year universities were the least diverse institutions: 46% of students were white, and 34% of students were Black, Indigenous, or people of color (BIPOC). About 21% did not identify their race. (Best College)
- In 2022, the college enrollment rates for 18- to 24-year-old females overall (44 percent) and for females who were Asian (64 percent), White (46 percent), Black (39 percent), and Hispanic (39 percent) did not measurably differ from the rates in 2012. (NCES)
- 68% of Asian or Pacific Islander adults aged 25 to 29 have a bachelor’s degree, compared with 45% of white, 28% of Black, and 25% of Hispanic young adults. (Brookings)
- Enrollment rates also differ significantly by race or ethnicity: 83% of Asian, 72% of white, and 63% of Hispanic.62% of Black students enroll in college within a year and a half of expected high school graduation.(Brookings)
- Asian students are the most likely to enroll in any college (83%), followed by white students(72%), and Hispanic and Black students (63% and 62%, respectively).(Brookings)
- The overall college enrollment rate for 18- to 24-year-olds was lower in 2022 than a decade earlier in 2012 (39 vs. 41 percent). (NCES)
- Between 2012 and 2022, white student enrollment dropped by 22%, or from 9 million to 7 million students across all higher education sectors, slightly outpacing Black student enrollment, which fell by 19%. In comparison, Asian student enrollment increased by 2%, and Latine student enrollment rose by 31%. (chronicle.com)
- White student enrollment fell from 47% of undergraduate students in 2018 to 41% in 2023, according to data from the Clearinghouse Research Center. (chronicle.com)
- In Fall 2023, there was a slight increase in overall undergraduate enrollment, but around 80% came from Black, Latine, and Asian students, while white student enrollment fell 2%, (chronicle.com)
- 15 colleges had their largest drops in Hispanic enrollment in over a decade, while four had their largest gains. (New York Times)
- In 2022, there were approximately 107,700 students with American Indian or Alaskan Native heritage enrolled at a university in the United States. (Statista)
- In 2024, 17 of these 59 colleges experienced their largest drops in Black enrollment in 14 years, while only three had their largest gains. (New York Times)
- This is a slight increase from the previous year when there were 106,600 students with American Indian or Alaska Native heritage enrolled in postsecondary education. (Statstica)
- The average share of incoming Black students at those colleges dropped by about one percentage point — from about 7 percent to 6 percent. (New York Times)
- The share of incoming Hispanic students at these colleges also fell by nearly one percentage point — from about 14 percent to 13 percent. (New York Times)
- Across the 59 selective colleges we could compare with historical data, the average share of Asian students was essentially unchanged. (New York Times)
- The share of incoming domestic Asian students at Johns Hopkins rose by 18 percentage points, and the share of incoming domestic white students at Middlebury rose by 10 percentage points. (New York Times)
- In 2024, the share of students at these 59 colleges who did not disclose their race or ethnicity increased from about 2 percent to 4 percent. (New York Times)
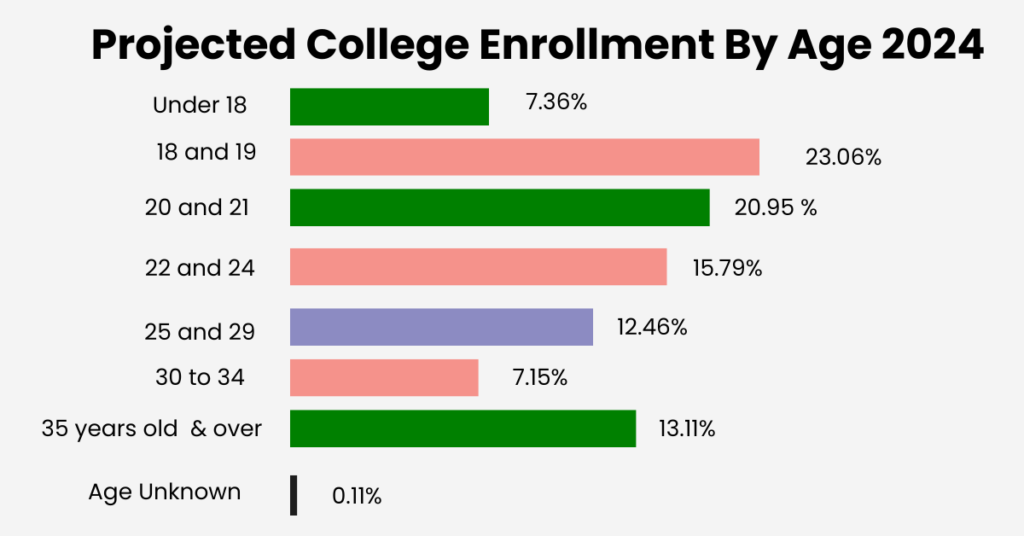
College Enrollment Stats by Age
- In 2021, around 35 percent of students enrolled in community colleges in the United States were aged between 22 and 39 years old & 8% were aged 40 years or older in that same year. (Statstica)
- In 1979, about 200,000 more women were enrolled in college than men. By 2021, that difference had grown to about 3.1 million more women than men in college. (Forbes)
- The Chronicle found that women students outnumbered men in every state. In 13 states, women made up 60% or more of college students. West Virginia, where 50.2% of college students were women, had the lowest percentage difference between men and women students. (Forbes)
- The overall college enrollment rate for 18- to 24-year-olds (the age range representing the majority of students who are enrolled in college1) was 39 percent in 2022. (NCES)
- In 2022, about 62% of U.S. high school graduates enrolled in college, and 36% of the U.S. population aged 25 and above had a Bachelor’s degree or higher (Talbott, 2024).
- The enrollment rate of college students aged 18 to 24 years old declined by 5%. (Research).
- The overall college enrollment rate for 18- to 24-year-olds fluctuated over the last decade but was lower in 2022 than in 2012 (39 vs. 41 percent). (NCES)
- The enrollment rate of college students in community colleges declined by 13.2%. (Research)
- This statistic shows the total number of students enrolled in Canadian colleges in 2019/20, by age group. In the academic year 2020/21, around 270,600 students aged between 20 and 24 years were enrolled in Canadian colleges. (Statstica)
- Of those aged 20 to 21 years of age in the United States, 52.8 percent were enrolled in higher education as of 2020, a considerable increase when compared to 31.9 percent in 1970. For those aged 18 to 19, 49 percent were enrolled in higher education in 2020. ( Statstica)
- The enrollment rate of college students aged 18 to 20 years old declined by 7.2%. (Research)
- The enrollment rate of 18-to-20-year-old college students in community colleges declined by 14.6%. (Research)
- Looking at enrollment rates by institution level over the same period, the rate for 2-year institutions decreased from 13 to 9 percent. (NCES)
- Nationwide, women comprised 58% of all college students in 2020, up from 56.6% six years earlier (Forbes)
College Enrollment Statistics By State
When it comes to college enrollment every state has its numbers, such as the states like Utah, Idaho, North Dakota, Arizona, and California have the highest college enrollment which is nearly 7%, but at the same time, some states have the lowest college enrollment rates.
These states include Alaska at 2.39% and Washington at 3.26% are only enrolled in the undergraduate program in the college, but to give you a complete idea.
Here is the complete list of the states along with the number of enrollments and percentage change from past years.
| State | No. of Enrollments | Percentage Change |
| Alabama | 267,435 | 2.40% |
| Alaska | 19,425 | 1.20% |
| Arizona | 489,057 | 0.80% |
| Arkansas | 137,733 | 3.20% |
| California | 2,379,280 | 2.20% |
| Colorado | 285,516 | 0.00% |
| Connecticut | 164,573 | -2.50% |
| Delaware | 55,506 | 0.40% |
| District of Columbia | 80,110 | -1.20% |
| Florida | 906,792 | 0.10% |
| Georgia | 533,776 | 4.10% |
| Hawaii | 53,998 | 1.30% |
| Idaho | 120,216 | 2.10% |
| Illinois | 607,692 | 2.00% |
| Indiana | 351,439 | 3.10% |
| Iowa | 180,566 | -1.00% |
| Kansas | 175,852 | 2.10% |
| Kentucky | 253,146 | 4.00% |
| Louisiana | 205,714 | -3.30% |
| Maine | 73,199 | 1.00% |
| Maryland | 329,370 | 2.70% |
| Massachusetts | 448,976 | 3.40% |
| Michigan | 452,689 | 0.60% |
| Minnesota | 273,420 | 1.70% |
| Mississippi | 145,651 | 2.70% |
| Missouri | 310,926 | 0.50% |
| Montana | 46,939 | 4.80% |
| Nebraska | 117,725 | -1.20% |
| Nevada | 104,709 | -2.10% |
| New Hampshire | 47,528 | -3.10% |
| New Jersey | 356,541 | -2.20% |
| New Mexico | 100,871 | 1.30% |
| New York | 1,056,172 | -0.50% |
| North Carolina | 541,043 | 0.20% |
| North Dakota | 50,345 | 1.50% |
| Ohio | 542,728 | 0.30% |
| Oklahoma | 180,258 | 1.90% |
| Oregon | 182,258 | -1.40% |
| Pennsylvania | 671,514 | -1.20% |
| Rhode Island | 67,391 | 0.90% |
| South Carolina | 241,761 | 1.90% |
| South Dakota | 46,200 | 2.00% |
| Tennessee | 287,634 | -0.50% |
| Texas | 1,543,320 | 0.90% |
| Utah | 249,466 | 4.10% |
| Vermont | 35,586 | -2.40% |
| Virginia | 512,518 | 1.10% |
| Washington | 292,136 | 2.50% |
| West Virginia | 73,568 | 0.30% |
| Wisconsin | 294,157 | -1.40% |
| Wyoming | 28,148 | -1.10% |
| Online/Multi-State | 1,264,225 | Not specified |
Source: University Business, Best college, educationdata.org, Research.com
College Enrollment by Gender or Sex
- 36,576 of first-time students are female; 29,191 are male.
- 14,400 of first-time students are female; 1,049 are male.
- 201,046 of first-time students are female; 180,804 are male.
- 17,570 of first-time students are female; 14,062 are male.
- 5,693 of first-time students are female; 4,041 are male.
- 6,916 of first-time students are female; 3,786 are male.
- In 1980, 51.4% of college enrollment included female students.
- Women aged 25 and older are more likely than men to have a four-year college degree. The gap in college completion is even wider among younger adults ages 25 to 34.
- A majority (62%) of U.S. adults ages 25 and older don’t have a four-year college degree, according to a Pew Research Center analysis of Current Population Survey data.
- Roughly four in ten (42%) say a major reason why they have not received a four-year college degree is that they couldn’t afford college.
- Roughly a third (34%) of men without a bachelor’s degree say a major reason they didn’t complete college is that they just didn’t want to and only four women say the same.
- Women (44%) are more likely than men (39%) to say not being able to afford college is a major reason they don’t have a bachelor’s degree.
- Women are 11 percentage points more likely to graduate from a four-year institution in four years and 7 percentage points more likely to graduate within six years
- Some 44% of college graduates – including 45% of men and 43% of women – say their college education was extremely useful to them in opening doors to job opportunities.
- In 2022, women were 9 percentage points more likely to be enrolled in college in the fall following high school graduation, a gap that has steadily widened in recent decades.
- Men are also less likely to complete college than women: the four-year graduation rate at four-year institutions, for example, is 54% for female students compared to 43% for male students
- 38% of men and 40% of women say that a smaller share of bachelor’s degree holders was extremely useful in helping them develop specific skills and knowledge that could be used in the workplace.
- Non-college-educated men are also more likely than their female counterparts to say a major reason they don’t have a four-year degree is that they didn’t need more education for the job or career they wanted (26% of men say this vs. 20% of women).
- There are now 2.4 million more female than male undergraduates on U.S. campuses (8.9 million women compared to 6.5 million men), a gap that is largely driven by stagnating male enrollment in 4-year colleges.
- In 2021, men received 42% of bachelor’s degrees awarded in the United States, the lowest male share on record and approximately equal to the 43% of bachelor’s degrees awarded to women in 1970.
- In 16 states, women had a college graduation rate of 70% or higher (Massachusetts was tops with 78%), while men achieved that level in only two states (Massachusetts at 72.9% and Rhode Island at 71.3%).
- In October 2008, a larger share of 18- to 24-year-old women were enrolled in college (42.3%) than their male counterparts (37%), but young female college enrollment was not much different than its October 2005 peak (42.5%).
- The percentage of 18- to 24-year-old men enrolled in college reached an all-time high in October 2008 (37.0%)
- Female students comprised the majority of college enrollment, with more than 11.2 million enrollments.
- Male enrollment was 2 million less than female enrollment, with around 8 million enrolled male students in all higher education institutions
- The total fall enrollment of first-time degree seekers included 1,300,472 male students and 1,565,003 female students.
- The same enrollment category included 1,297,811 female students and 1,081,567 male students enrolled in full-time studies.
- In comparison, of the total first-time degree-seeking students, 218,905 male students and 267,192 female students were enrolled in part-time studies.
- Of the total undergraduate enrollment, 2,373,683 male students enrolled in 2-year institutions; 4,774,847 in 4-year institutions.
- In comparison, 3,265,885 undergraduate male students enrolled in 2-year institutions in 2010, and 4,570,397 enrolled in 4-year institutions.
- Of the total fall college enrollment in any postsecondary institution, 57.4% were female students; 42.5% male students.
- 60.2% of undergraduate female students enrolled full-time and 39.7% in part-time studies.
- 31.6% of all postsecondary studies enrollment were female (in degree-credit registration).
- Of the total 5.9 million college enrollments in 1965, 38.7% were female students.
- In 2020, 11.7% of female students enrolled in 4-year master’s degree programs in public institutions; 27.4% in 2-year institutions.
Source: Forbes, Pew Research, Erudera, Statstica, Census gov, Aibm.org
Study Abroad Enrollment Stats
- 42.7% of study-abroad students travel overseas during their junior year.
- 38.6% of study abroad students travel during a summer term.
- Almost three out of four UNI students (74%) studied abroad on summer or short-term programs, while 25% spent a semester abroad
- Almost 60% of participants graduated in four years compared to 57.3% of applicants and 44.9% of non-participants.
- Over the eight-year period for which data were available, study abroad participants had the highest graduation rate at 97.5% compared to applicants at 93.6% and non-participants at 77.2%.
- Other countries that saw large increases in U.S. students studying abroad included Japan (18 percent), Netherlands (17.2 percent), Denmark (14.8 percent), New Zealand (14.5 percent), Czech Republic (12.6 percent), and South Africa (10.2 percent).
- In the academic year 2015/16 a total of 325,339 U.S. students studied abroad for academic credit, an increase of 4 percent over the previous year.
- The top ten destinations for U.S. students studying abroad were: the United Kingdom, Italy, Spain, France, Germany, China, Ireland, Australia, Costa Rica, and Japan.
- Cuba had the highest rate of growth among leading destinations in 2015/16, increasing by 58.6 percent.
- Other countries that saw large increases in U.S. students studying abroad included Japan (18 percent), Netherlands (17.2 percent), Denmark (14.8 percent), New Zealand (14.5 percent), Czech Republic (12.6 percent), and South Africa (10.2 percent).
- Summer term remained the most popular time to study abroad, with 38 percent of students going abroad during the summer in 2015/16.
- This reflects a growing interest in short-term programs among students, with 60 percent of students studying abroad in programs less than eight weeks in length.
- Thirty-two percent of students studied abroad for a full semester, down from 5 percent in 2005/06, and less than 3 percent of students studied abroad for an academic or calendar year.
- Students majoring in the STEM Fields – comprised of agriculture, engineering, health professions, math, computer science, and physical or life sciences majors – represent the largest proportion of students studying abroad at 25 percent (NCES)
- Business and Management at 20 percent and Social Sciences at 17 percent are the other popular major fields of study represented among students who study abroad. (Study Abroad U.S Department).
Source: Board Of Regents, Digitalcommons.unl.edu, NCES, and Study Abroad (U.S Department)
Conclusion
From every post you have seen the college enrolment statistic you have also seen the rate of admission in the college by age gender and by state additionally, you have also seen how this number is growing over the past few years.
I hope you found the above post helpful but if you still have any questions or queries regarding the college enrolment statistic please let me know in the comment section.
Sources Used in this Article
- https://nces.ed.gov/programs/coe/pdf/2024/cpb_508c.pdf
- https://www.equityinhighered.org/indicators/enrollment-in-undergraduate-education/college-enrollment-rates/
- https://todaysstudents.org/todays-students/
- https://www.brookings.edu/wp-content/uploads/2023/02/20230123_CCF_CollegeEnrollment_FINAL2.pdf
- https://feed.georgetown.edu/access-affordability/why-are-fewer-white-students-attending-college/#:~:text=Between%202012%20and%202022%2C%20white,student%20enrollment%20rose%20by%2031%25.
- https://www.chronicle.com/article/affluent-white-students-are-skipping-college-and-no-one-is-sure-why
- https://www.nytimes.com/interactive/2025/01/15/upshot/college-enrollment-race.html
- https://www.statista.com/statistics/236489/undergraduate-enrollment-by-ethnicity-in-the-us/#:~:text=In%202022%2C%20there%20were%20approximately,heritage%20enrolled%20in%20postsecondary%20education.
- https://www.forbes.com/sites/michaeltnietzel/2024/08/07/women-continue-to-outpace-men-in-college-enrollment-and-graduation/#:~:text=In%201979%2C%20about%20200%2C000%20more,outnumbered%20men%20in%20every%20state.
- https://www.census.gov/programs-surveys/cps.html
- https://nces.ed.gov/ipeds/
- https://www.aau.edu/sites/default/files/AAU-Files/Key-Issues/Campus-Safety/Revised%20Aggregate%20report%20%20and%20appendices%201-7_(01-16-2020_FINAL).pdf